Canvas — the modern dashboard
you build by describing it

Overview
Every CS org accumulates dashboards nobody trusts. Someone built them for a QBR two quarters ago, the BI team is backed up three weeks, and the answer you need today — health distribution across the book, which accounts lost a champion this month — still means a Slack message and a wait. Canvas removes the wait. Describe the view in plain English and Canvas builds it: chart, table, and the accounts behind it.
What’s Canvas
Canvas is a modern dashboard that starts with a question instead of a query. Type what you want to see — top feature requests from this week’s calls, expansion-ready accounts, health trend for the enterprise segment — and Canvas figures out the underlying data pull and the right way to visualize it. No SQL, no query builder, no BI backlog.
Views to start with
Not sure what to ask for first? These are the views CS teams reach for on day one:
- At-risk accounts approaching renewal — every account with a declining health score and a renewal inside the next 60 days, sorted by ARR so the biggest exposure sits at the top.
- Book of business by risk level — the full book bucketed into Healthy, At Risk, and Critical, with the account list behind each bucket one click away.
- Champions who’ve gone quiet — stakeholders with no engagement in the last 30 days, surfaced before a renewal conversation catches you off guard.
- Feature requests blocking upcoming renewals — product asks tied to accounts renewing this quarter, so roadmap conversations connect straight to revenue at risk.
- Most common support issues, last 3 months — the recurring themes across tickets, so you know where friction is concentrated before it shows up in health scores.
- Expansion opportunities this quarter — accounts with usage or seat growth that haven’t been pitched yet, ranked by potential ARR.
Ask for any of these by name, or describe your own — Canvas builds the view either way.
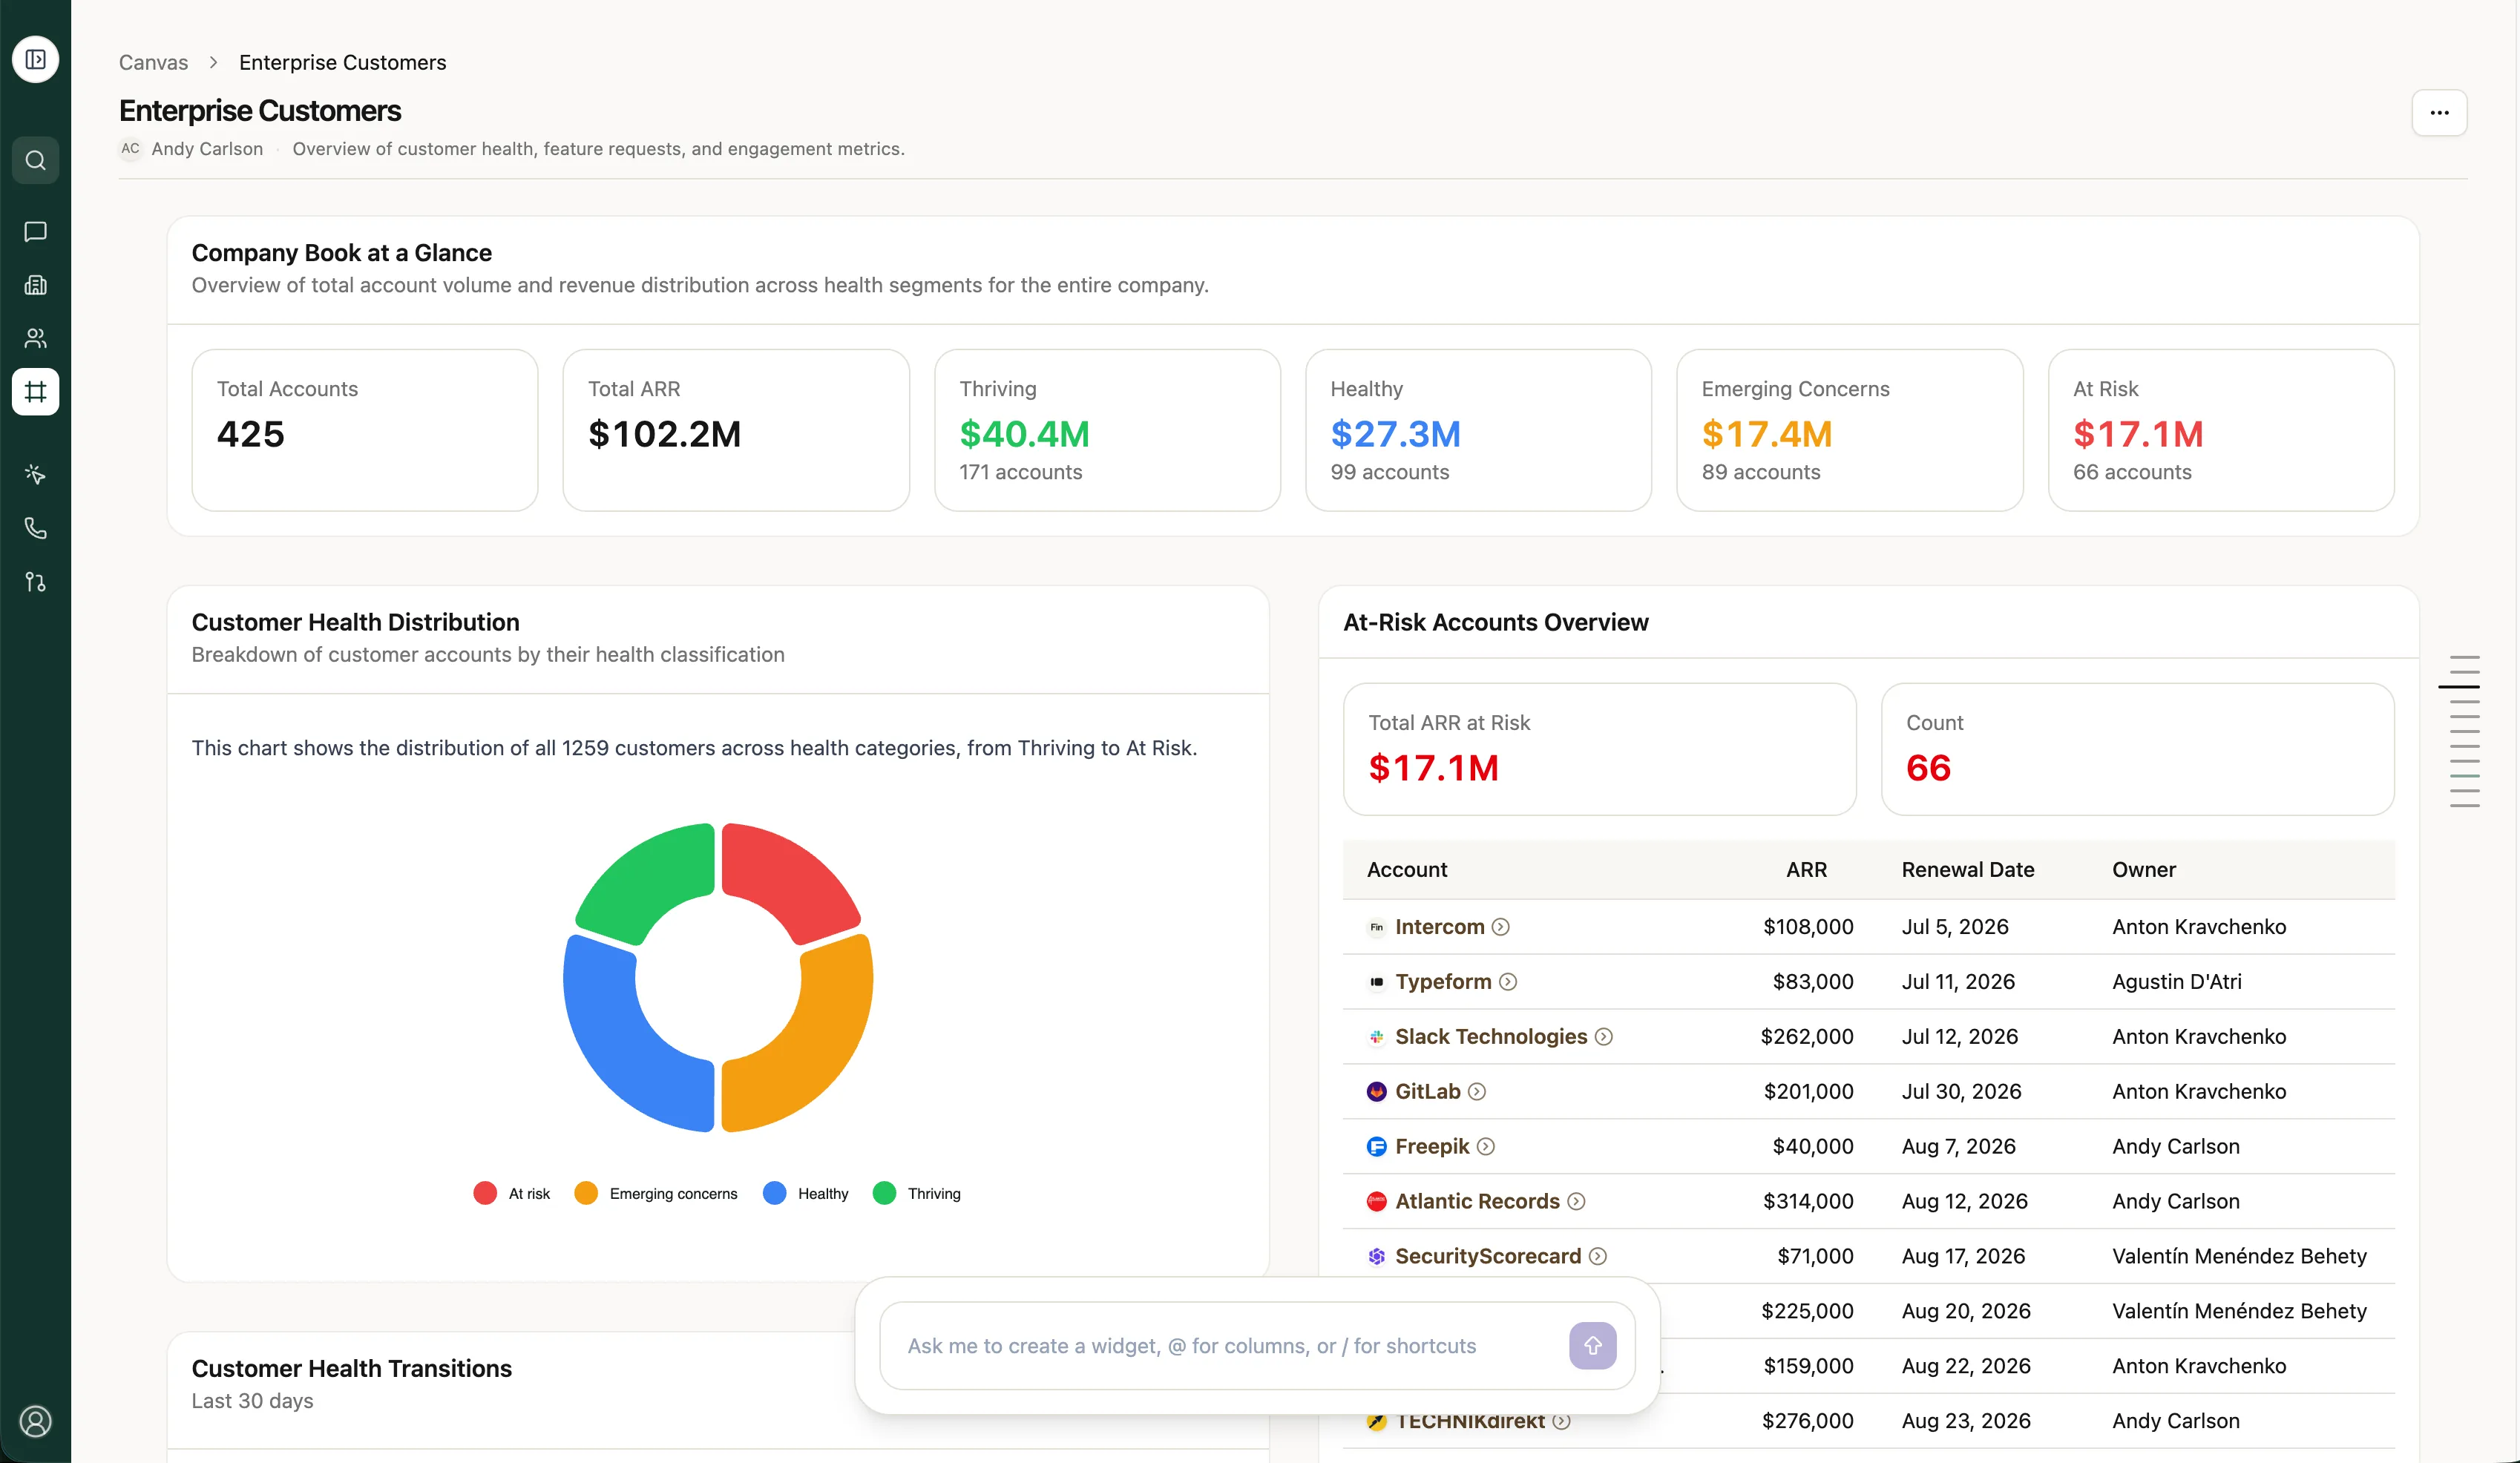
Drill into the accounts behind any number
Every chart links to the accounts that produced it. A metric is never a dead end — click it, and you’re looking at the actual customer list behind the number, ready to act on.
Refine by asking
Views don’t have to be rebuilt to change. Narrow a view, pivot it to a different segment, or re-cut the timeframe by asking a follow-up question in conversation, the same way you’d ask a colleague to adjust a report.
Your book, your view
Every CSM and AM gets a personal view of their own accounts, renewals, and open risks. Leadership sees the roll-up across the full book. Same underlying data, scoped to whoever’s looking at it.
Scheduled delivery
Save any view and schedule it to email or Slack on whatever cadence makes sense — a daily standup digest, a weekly leadership roll-up, a pull that lands automatically before every QBR. Nobody has to remember to go build it.
Get started
Canvas lives at Canvas in the main navigation. Type your first question and Canvas will build the view — no setup required. Teams using Canvas are cutting QBR prep time by 8x with zero lines of SQL. Reach out to your CSM if you want a walkthrough of what to ask for first.